Amazon CloudWatch: A Deep Dive for Cloud Engineers
Amazon CloudWatch is a vital tool for cloud engineers, offering comprehensive monitoring, logging, and observability capabilities for AWS environments. This deep dive covers the key features, practical scenarios, and best practices for using CloudWatch, ensuring you can maximize its potential for your applications and infrastructure.
Key Features of Amazon CloudWatch
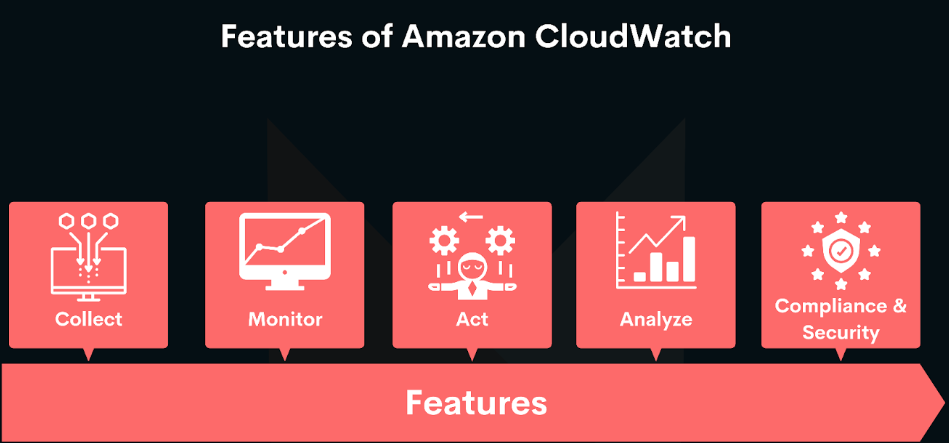
Metrics
Standard Metrics
Amazon CloudWatch provides predefined metrics for various AWS services:
- EC2: Metrics like CPU utilization, disk read/write operations, and network traffic.
- RDS: Metrics such as database connections, read/write latency, and free storage space.
- S3: Metrics including bucket size, number of objects, and request counts. Standard metrics are collected at five-minute intervals, with an option for detailed monitoring at one-minute intervals.
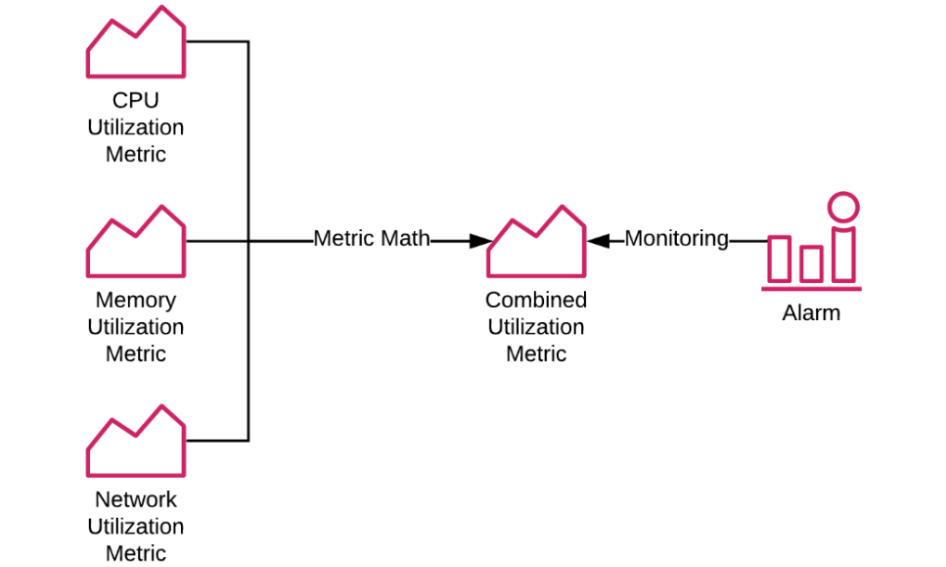
Custom Metrics
CloudWatch allows you to define and monitor custom metrics specific to your applications or business needs. You can push data using the AWS SDK, AWS CLI, or CloudWatch Agent. This flexibility enables you to monitor any aspect of your application, from performance data to business KPIs.
Detailed Monitoring
Enabling detailed monitoring collects metrics at one-minute intervals, providing a granular view of resource performance. This is particularly useful for applications with variable workloads requiring close monitoring.
Logs
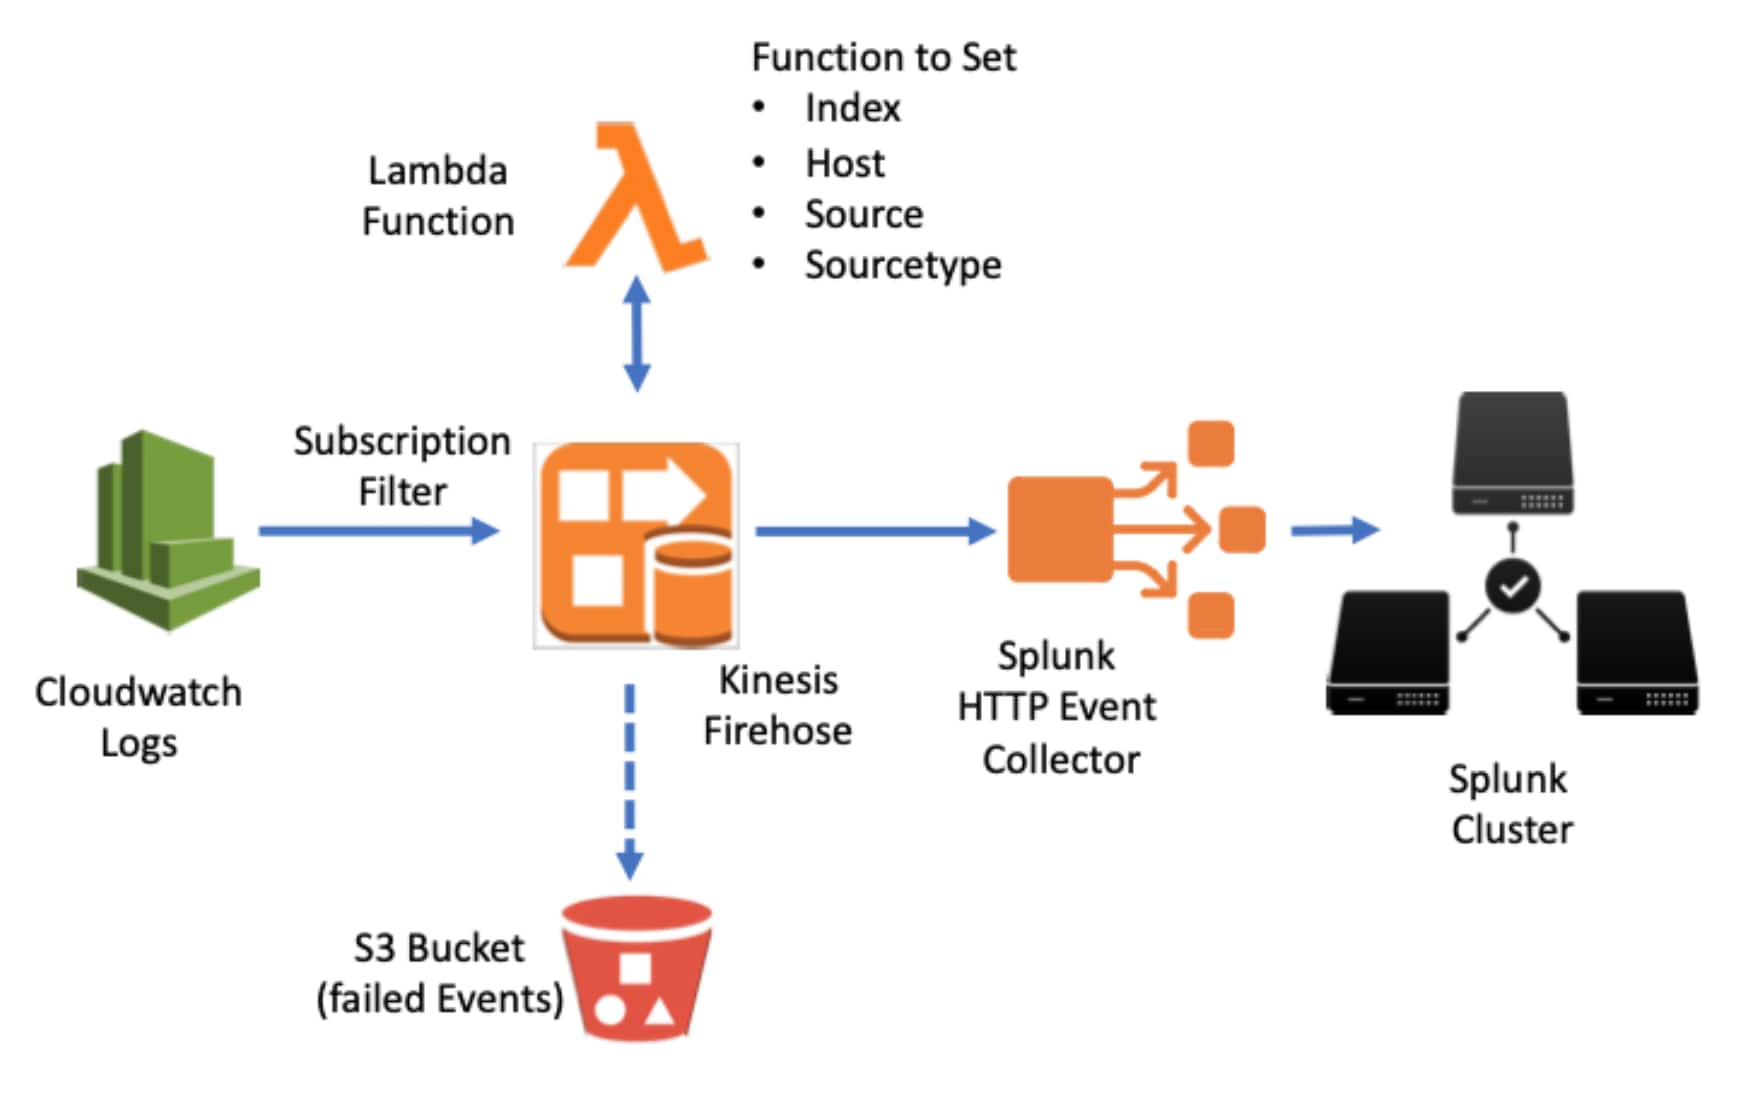
Log Groups
Log groups are logical groupings of log streams that share the same retention, monitoring, and access control settings. They help organize logs for different applications, environments, or services.
Log Streams
Log streams are sequences of log events from the same source, such as an application instance or server. AWS services can automatically create log streams, or you can define them manually.
Retention Policies
Retention policies control how long log events are stored in CloudWatch Logs. You can set policies to automatically delete old log events after a specified period, helping manage storage costs and ensuring compliance with data retention requirements.
Alarms
Creating Alarms
Creating alarms involves selecting a metric, setting thresholds, and defining actions:
- Thresholds: Define the condition (e.g., greater than, less than) and value for the alarm.
- Actions: Specify what should happen when the alarm state changes, such as sending notifications, triggering Auto Scaling, or performing EC2 instance actions.
Actions
- Notifications: Integrate with Amazon SNS to send alerts via email, SMS, or HTTP endpoints.
- Auto Scaling: Adjust the number of EC2 instances based on demand.
- EC2 Actions: Automate stopping, terminating, rebooting, or recovering EC2 instances based on performance criteria.
Dashboards
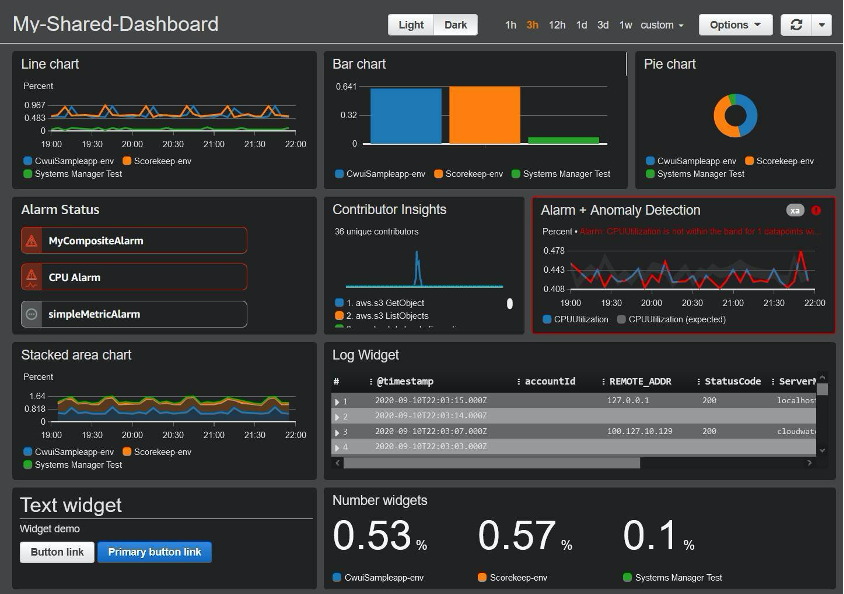
Widgets
Dashboards support various widgets, including line charts, stacked area charts, number displays, and text widgets. These widgets can be customized to display specific metrics and logs.
Cross-Account Dashboards
Monitor metrics from multiple AWS accounts on a single dashboard, ideal for organizations with multi-account setups for development, staging, and production environments.
Sharing and Access Control
Use AWS IAM to control who can view or edit dashboards, ensuring secure sharing with team members or stakeholders.
Events and Rules
Event Patterns
Define patterns to capture specific events, such as EC2 instance state changes or S3 bucket modifications. Use the AWS Management Console, AWS CLI, or SDKs to set these patterns.
Targets
Specify actions to take when an event matches a pattern. Targets can include AWS Lambda functions, SNS notifications, Step Functions, or ECS tasks, enabling automated operational tasks like backups, security checks, and infrastructure scaling.
ServiceLens
Tracing
Instrument your application with AWS X-Ray to trace requests, identify performance bottlenecks, and visualize service interactions. Combine CloudWatch metrics, logs, and X-Ray traces for comprehensive monitoring.
Health Overview
Display the health of various application components, using service maps and latency distribution graphs to understand performance and quickly identify issues.
Synthetics

Creating Canaries
Write canary scripts in Node.js or Python to monitor APIs and endpoints. Use pre-built blueprints for common scenarios, and configure the frequency and duration of canary runs.
Scheduling
Schedule canaries to run at regular intervals, ensuring continuous monitoring of endpoint availability and performance.
Analysis
Analyze canary results to detect performance issues and outages, using detailed reports and metrics.
Contributor Insights
Rules
Define rules to specify which log data to analyze and how to aggregate it, identifying top contributors to system performance.
Aggregation
Aggregate log data to uncover patterns and trends, using predefined or custom metrics for analysis.
Visualization
Display top contributors in CloudWatch Dashboards for real-time visibility, and generate reports to understand their impact on performance.
CloudWatch Agent

Installation
Install the CloudWatch Agent using AWS Systems Manager or manually on your instances. It supports various operating systems, including Linux and Windows.
Configuration
Define which metrics and logs to collect using a JSON configuration file, and collect additional custom metrics like memory usage and disk space.
Integration
Integrate the CloudWatch Agent with other AWS services like Lambda, ECS, and EKS for comprehensive monitoring and centralized data collection.
CloudWatch Logs Insights
Query Syntax
Use SQL-like commands such as filter, stats, parse, and fields to query logs, performing complex searches and aggregations to uncover trends and patterns.
Performance
Optimized for speed and efficiency, Logs Insights enables quick insights even with large volumes of log data, scaling seamlessly with your needs.
Use Cases
- Troubleshooting: Quickly identify and resolve application issues by querying logs for specific error messages or performance metrics.
- Behavior Analysis: Analyze user behavior and system interactions.
- Security Monitoring: Monitor and analyze security-related events and activities.
Practical Scenarios and Best Practices
Setting Up CloudWatch Alarms
- Identify Critical Metrics
- Determine the key metrics critical to your application's performance, establish baseline performance, and set realistic thresholds to avoid false positives.
- Create Alarms
- Select metrics, set conditions, define actions, and test alarms to ensure they trigger correctly and perform desired actions.
Best Practices
- Avoid False Positives: Use appropriate thresholds and anomaly detection.
- Combine Alarms: Use composite alarms to reduce alert noise.
- Test Alarms: Regularly test to ensure proper functioning.
Analyzing Log Data with CloudWatch Logs Insights
- Collect Log Data
- Configure logging, define log groups and streams, and use structured logging for easier querying.
- Query Logs
- Write and save queries, perform basic and advanced searches, and schedule periodic queries for continuous monitoring.
Best Practices
- Indexing: Use structured logging for easier queries.
- Retention Policies: Manage storage costs with appropriate retention policies.
- Dashboards: Integrate Logs Insights queries into dashboards.
Visualizing Data with CloudWatch Dashboards
- Create a Dashboard
- Add and customize widgets, arrange and resize them, and group related widgets together for a logical layout.
- Share Dashboards
- Set permissions using AWS IAM, and securely share dashboards with team members or stakeholders.
Best Practices
- Modular Design: Focus on specific aspects like performance, health, and security.
- Real-Time Monitoring: Use real-time widgets for critical metrics.
- Regular Updates: Keep dashboards updated with new metrics.
Automating Responses with CloudWatch Events
- Define Event Rules
- Set up event patterns to capture specific events and specify actions to take when events match the pattern.
- Set Targets
- Choose targets such as AWS Lambda, SNS, Step Functions, or ECS tasks for automated responses.
- Test and Refine
- Test rules, monitor execution, and adjust patterns and targets based on results and requirements.
Best Practices
- Granular Rules: Minimize false positives with specific patterns.
- Chain Events: Use events with other AWS services for complex automation.
- Security: Ensure targets have necessary permissions.
Monitoring Application Performance with ServiceLens
Tracing
Enable X-Ray, visualize service maps, and analyze traces to identify performance bottlenecks.
Health Overview
Configure and monitor key metrics, set alarms for critical metrics, and use dashboards to visualize service health.
Best Practices
- Comprehensive Instrumentation: Ensure all critical parts are instrumented.
- Integrated Monitoring: Combine ServiceLens with other CloudWatch features.
- Proactive Analysis: Regularly review maps and trace data.
Using CloudWatch Synthetics for API and Endpoint Monitoring
Creating Canaries
Write scripts or use blueprints, configure canary runs, and schedule at regular intervals.
Analysis
Review canary results, analyze detailed reports, and set up alarms based on results.
Best Practices
- Realistic Checks: Simulate real user interactions.
- Alerting: Set alarms for real-time notifications.
- Continuous Improvement: Update scripts regularly.
Identifying Performance Bottlenecks with Contributor Insights
- Create Rules
- Define patterns and fields to analyze, and use aggregation functions to identify top contributors.
- Visualization
- Integrate data into dashboards and generate reports for performance insights.
Best Practices
- Focused Analysis: Target specific areas of interest.
- Regular Review: Continuously review insights.
- Actionable Insights: Use insights for informed decisions and optimizations.
Final Thoughts on Amazon Cloudwatch
Amazon CloudWatch is an indispensable tool for cloud engineers, providing comprehensive monitoring, logging, and observability capabilities. By leveraging CloudWatch’s extensive features and following best practices, you can gain deep insights into your AWS environments, optimize performance, ensure security, and enhance the reliability of your applications. This deep dive equips you with the knowledge to effectively use CloudWatch and maximize its potential for your cloud infrastructure.
Did you like this post?
If you did, please buy me coffee 😊
No comments yet.